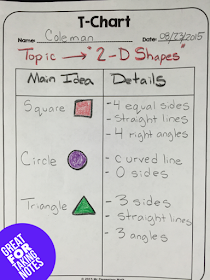
T-Charts are not just for the reading block! They can be used during math class to help students visually organize their thoughts and ideas. T-Charts are graphic organizers that are made up of two or more columns. T-Charts are very versatile, making it one of the more popular graphic organizers. They can be used to take notes, compare ideas and list main ideas and details.
This graphic organizer can be used when teaching any topic in the classroom. Here are some examples of how T-Charts can be used in math class.
 |
| Use a 2 column T-Chart for taking notes using main idea and detail. |
 |
| Use a 3 column T-Chart to compare and contrast math concepts. |
Here is a simple lesson cycle that can be used when introducing T-Charts in your classroom. Click on the image to get a printable copy. If you are a primary teacher I would recommend creating and filling out a T-Chart on oversized chart paper or on an interactive whiteboard.
There are many benefits to using T-Charts during instruction. Check out some of the benefits below:
- A great tool for collecting and organizing thoughts
- Provides a model for visual learners
- A powerful note taking strategy
- Integration of writing, reading and math (main idea and detail, compare and contrast)
- This strategy can be used across content areas
- This strategy is effective in all grade levels
Click Here to Download the Free T-Chart Template
If you like this blog post about using T Charts in the math classroom, check out my post about using concept maps HERE. Find even more great math resources at Mr Elementary Math TpT.
If you like this blog post about using T Charts in the math classroom, check out my post about using concept maps HERE. Find even more great math resources at Mr Elementary Math TpT.


No comments:
Post a Comment
Note: Only a member of this blog may post a comment.